Dane County Spatial Rainfall on 9/19/13
Rainfall maps produced from offical government stations such as USGS stations provide generalized maps covering broad geographical areas which do not provide fine detail at the county scale. In order to provide additional data and fill in spatial data gaps, data is obtained from personal weather stations reported through Weather Underground. In Dane County there are over 50 personal weather stations as compared to the less than 10 government sponsored stations. Even though the personal weather stations are non-authoritative, they provide an additional rainfall stations as compared to National Weather Service (NWS). We combine all data sources including government stations and personal weather stations to allow for spatial analysis of rainfall not previously considered now possible. Spatial interpolation techniques can be used to provide rainfall maps and can be broadly classified into two main groups: deterministic (Inverse Distance Weighting) and geostatistical (Kriging)
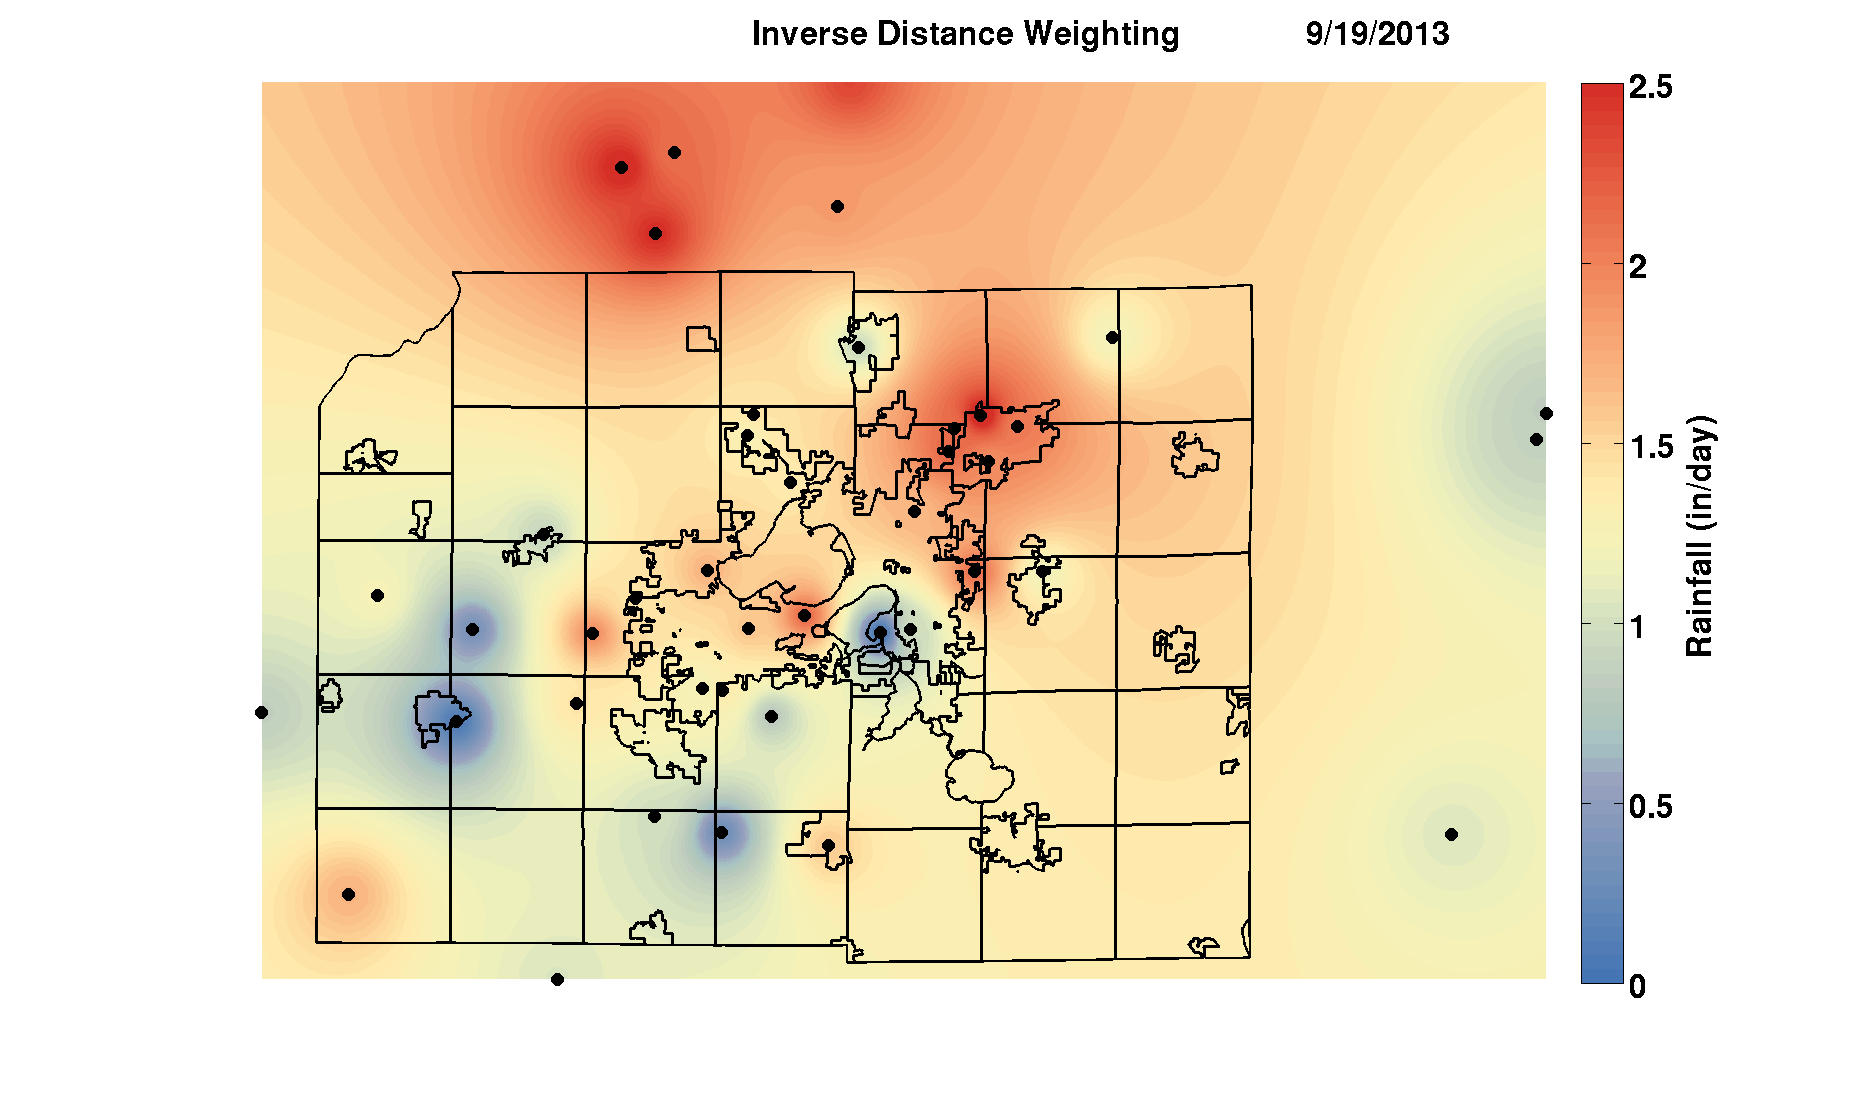
Inverse Distance Weighting

The Inverse Distance Weighting (IDW) method estimates the spatial fainfall by the weighted average of observed data at surrounding points. In order to compute the IDW a fine mesh grid is laid over the watershed area and the precipitation value is interpolated into each grid cell by using the inverse distance squared between the cell location and the gage location as a weight for each gage.
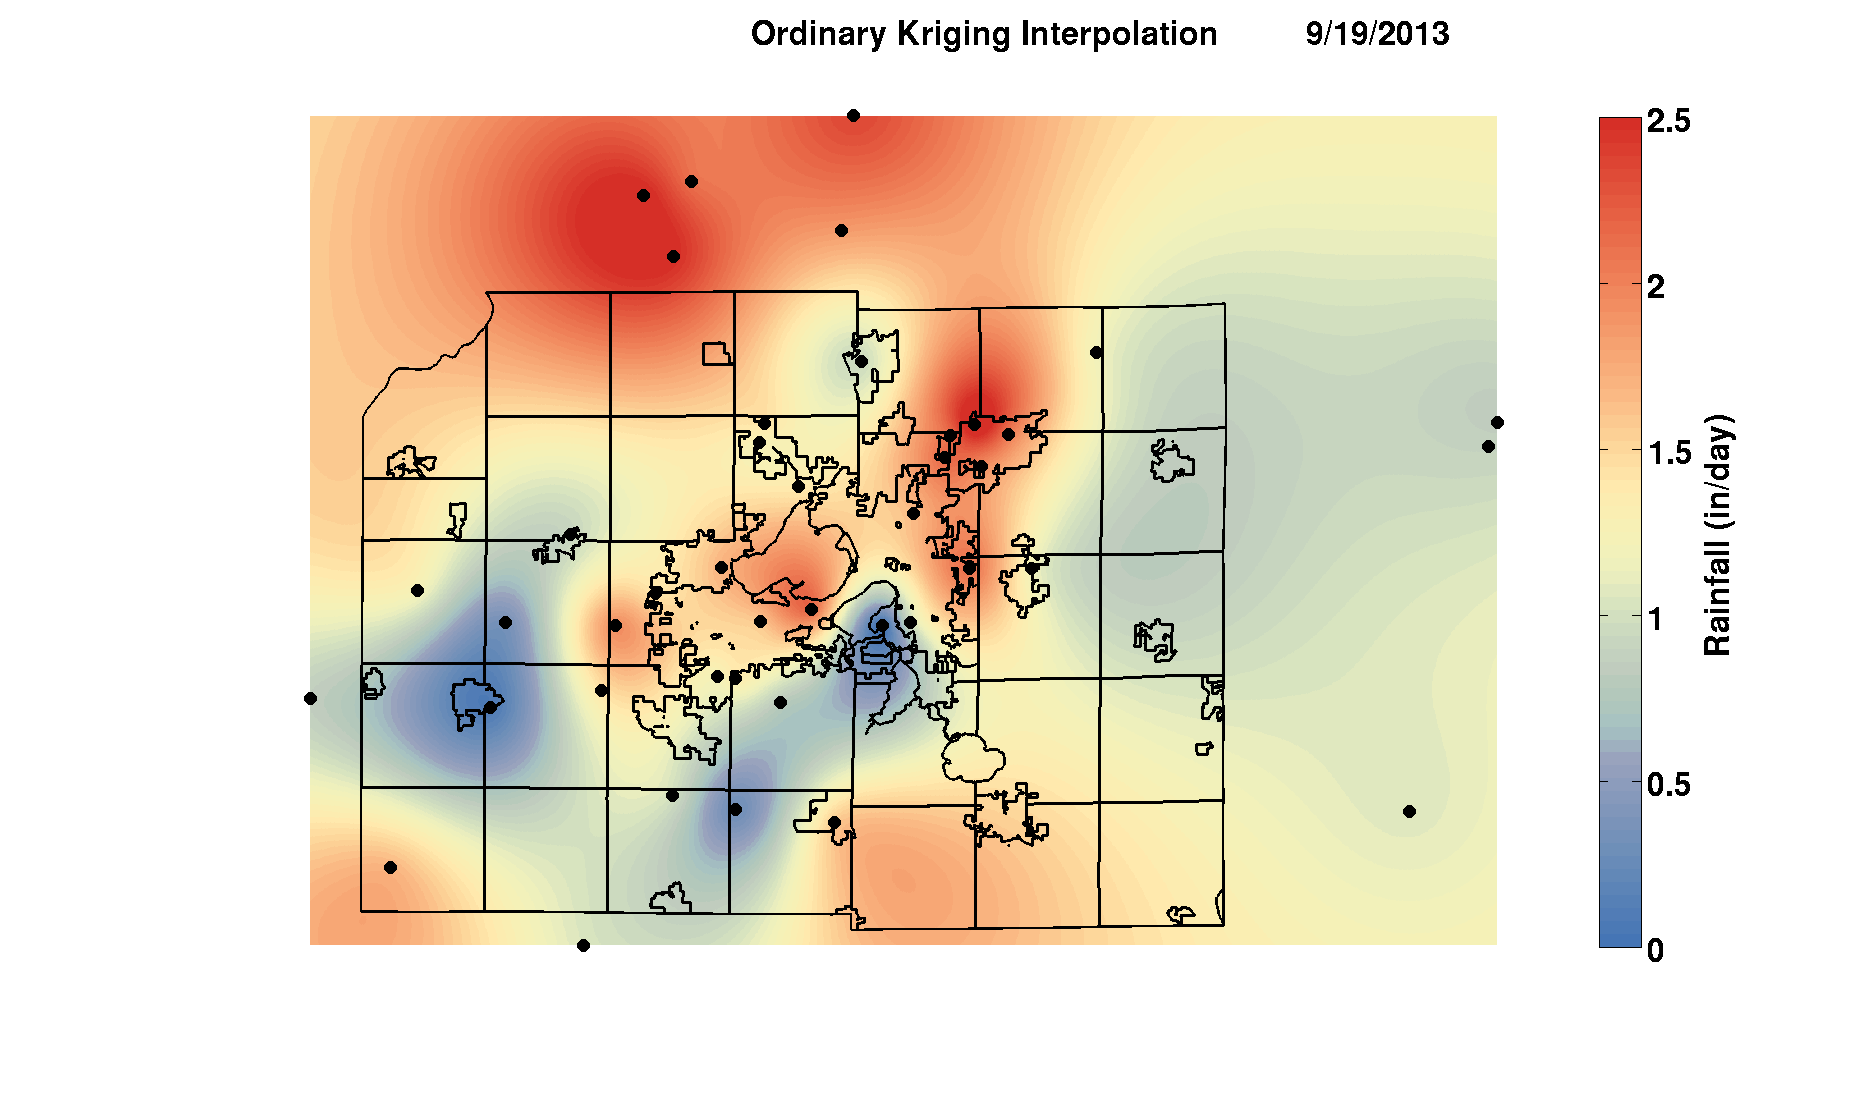
Ordinary Kriging

Kriging uses spatial correlation between neighboring observations to predict attribute values at unsampled locations. Unlike IDW which estimates the value at a given location as a weighted sum of data values at surrounding locations, kriging assings weights according to data-driven weighting function. The advantages of kriging are that it compensates for the effets of data clustering by treating clusters more like single points and provides estimation error (kriging variance shown below).
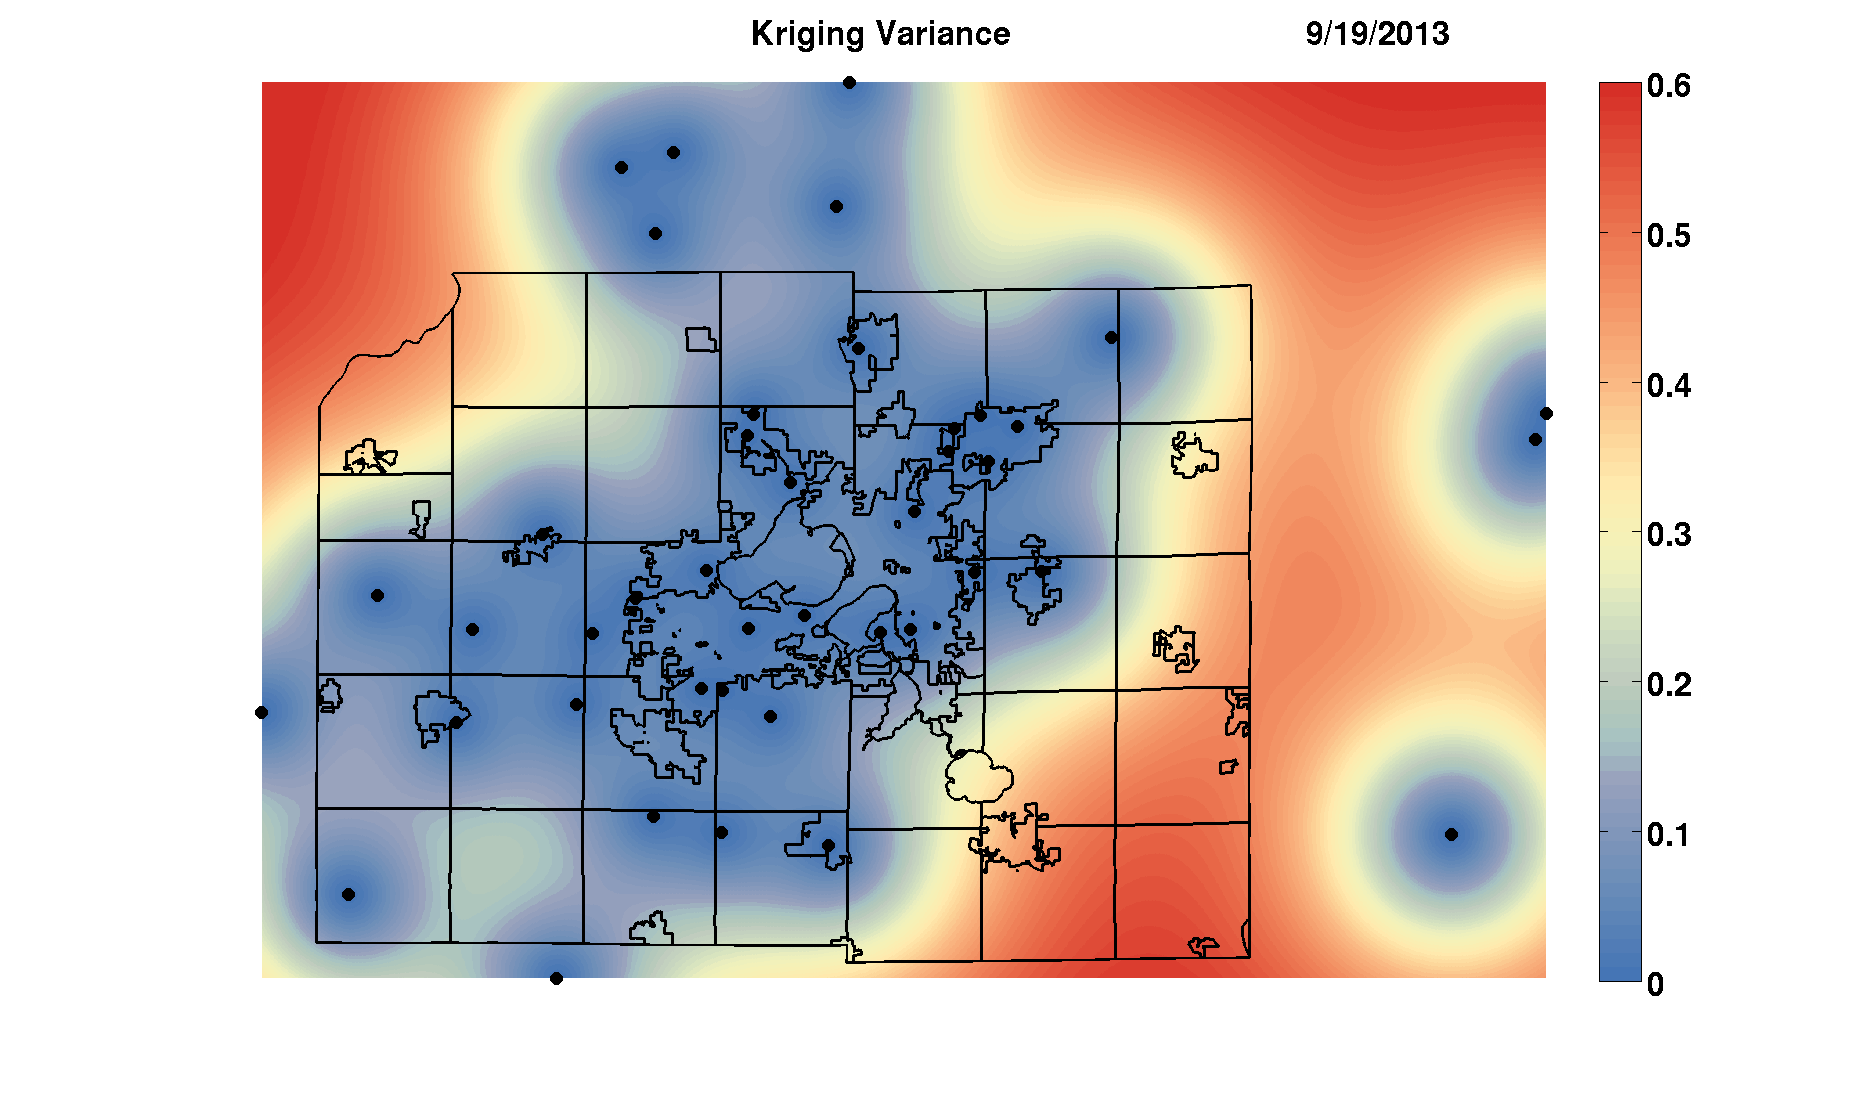
Kriging Variance

The kriging variance or uncertainty displays a colormap where the red indicates more uncertainty (larger variance) than blue. It is evident that the error variance is small if there exists more observed data.


